

- visualize measurement and process data
- create, delete and setup all master data
- control status of master data
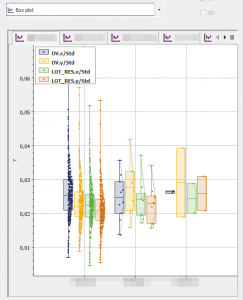
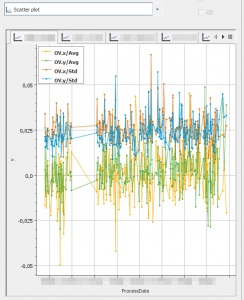
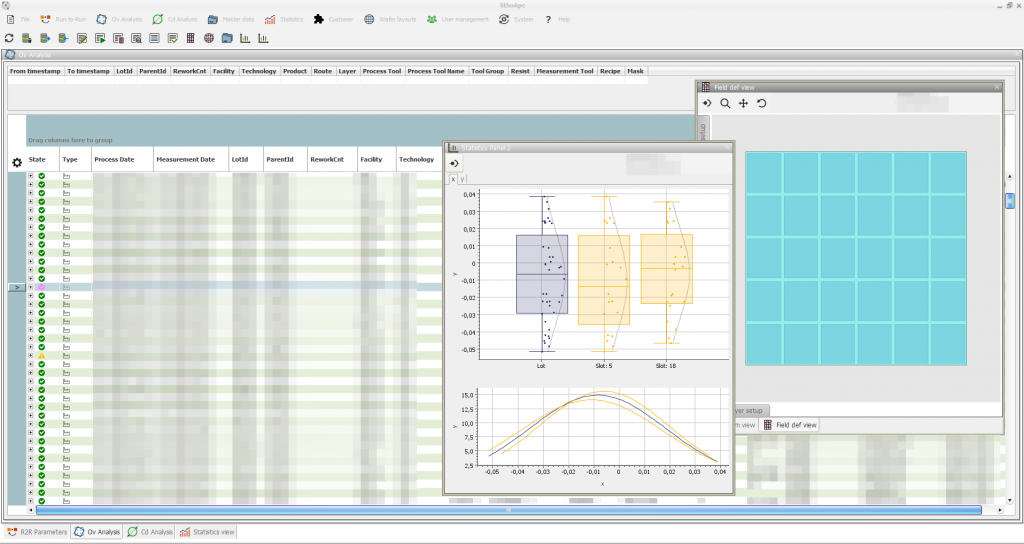
- visualize and compare all analysis results and intermediate information including
- systematic failure
- value and residual statistics
- residuals
- trigger manual analysis for single or selected runs
- edit run context information or measurement values
- access wafer visualizations
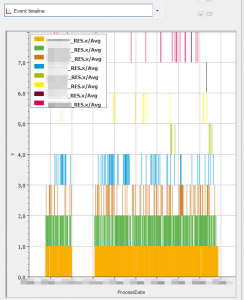
- visualize the process time line in diagrams
- access user management and system capabilities
- connect to any lithoAPC server in the network
- export and import functionality
- copy of all table information
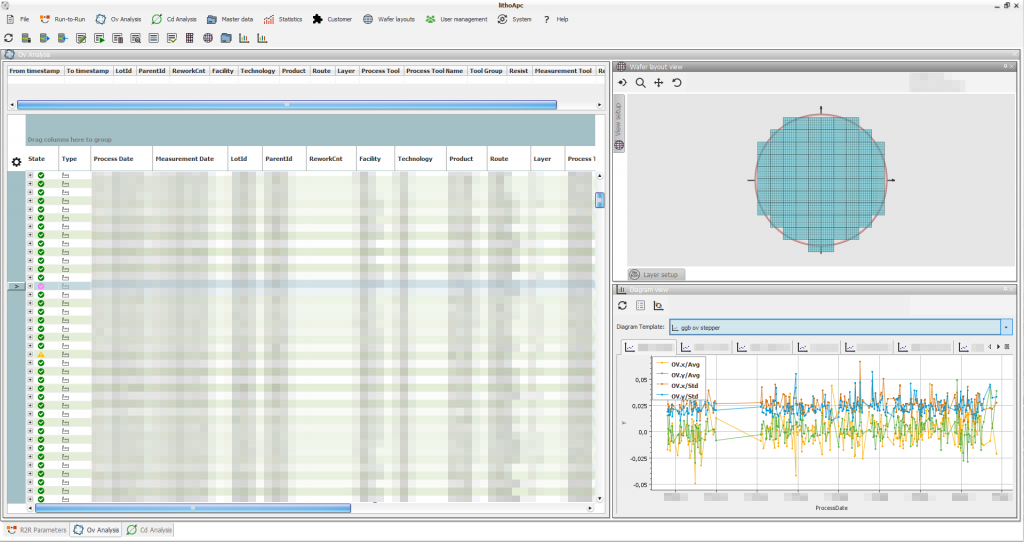
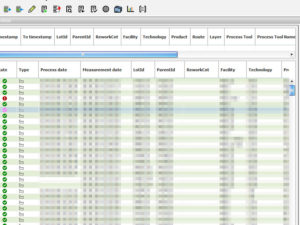 Screenshot RuntoRun View
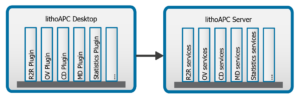
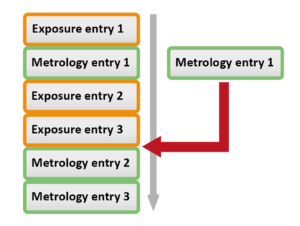
Incoming data is automatically merged with existing process information for the same lot and layer. The merge algorithm recognizes the correct sequence of exposures and measurements. Even complex use cases like tool aborts, reworks and splits are handled by the software.
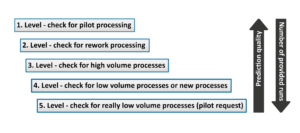
The system can be setup using R2R levels. With this approach, the entire process can be described from a R2R perspective. Especially for high mix production lines and tool mix without dedication, the R2R level support groups e.g. for similar tools or products. This apporach has proven itself in many advanced logic FABs over years. The use of R2R levels provides full access to all filter functions like
- flexible selection of filter criteria
- dynamic filter criteria (dynamically
evaluated
based on customer sources) - virtual grouping
- grouping by target or gradient values
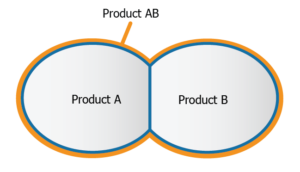 There are logic products, which are identical up to a certain process layer. Technically those products fit into the same controller group – but due to different product names these products often are handled completely independent of each other. To avoid pilot wafers runs and in order to learn from the other products within the group, lithoAPC enables the declaration of virtual product groups.
The common database filtering method is applied on database level. In addition a second filter is applied on system level, which takes care for all sophisticated filter criteria like dynamic context information. To ensure fastest response times a life stream to the database is used for filters, flier checks and validations. The filter supports complex criteria based on the current run context as well on any context information in the MES system. It includes the status information, scope of time and more. Without any additional effort, the user can filter – for example – by reference layer information or a process tool.
The calculation of the startup values is based on previous runs and their optimal process conditions. The system expects a continuous distribution and tests the data quality. The flier elimination will detect and remove all runs, which do not follow the common behavior. Flier elimination is based on a combination of absolute flier limits and the definition of relative tunnels. 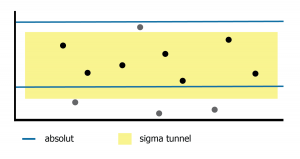
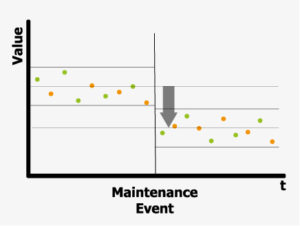
The integrated baseline correction is an advanced feature. Process parameters are not only subject of process behavior. There are also dependencies on the substrate, maintenance activities, resist batches or mask size. Often the impact is just an offset (bias) to the initial baseline. lithoAPC allows to specify such baseline offsets. With this information all available data can be used to predict new starting values even if the data are at different baseline levels. There is no need to delete any data and there is no need to run additional any pilot wafers.
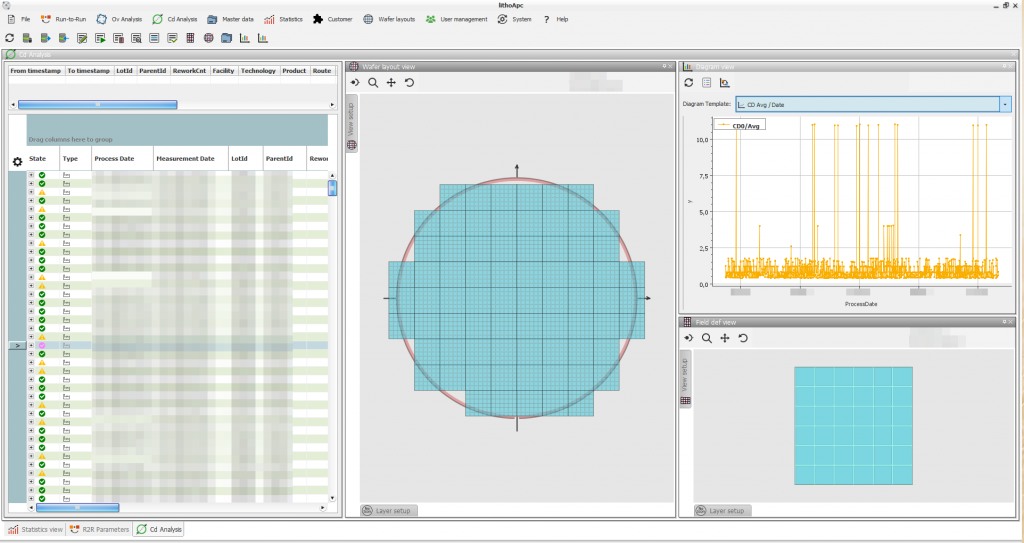
All modules are integrated into the APC desktop application. The user interface combines all functionality to setup, monitor and control the APC control. In details this covers:
- visualize measurement and process data
- create, delete and setup all master data
- control status of master data
- visualize and compare all analysis results and intermediate information including
- systematic failure
- value and residual statistics
- residuals
- trigger manual analysis for single or selected runs
- edit run context information or measurement values
- access wafer visualizations
- visualize the process time line in diagrams
- access user management and system capabilities
- connect to any lithoAPC server in the network
- export and import functionality
- copy of all table information
The ongoing development of the system will produce frequent new modules and new features accessible in the user interface.
 The analysis of lithoAPC is document and work-flow based. The work-flow is defined by the engineers in the master data. It contains the general flow of dedicated analysis steps and their settings. The document approach ensures, that all details of the analysis is collected into a single document, which is stored in the system database. It can be reviewed by the engineer at any time.
The calculation of the startup values is based on previous runs and their optimal process conditions. The system expects a continuous distribution and tests the data quality. The flier elimination will detect and remove all runs, which do not follow the common behavior.
Flier elimination is based on a combination of absolute flier limits and the definition of relative tunnels.
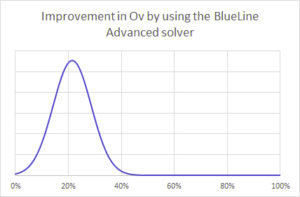
The “Advanced Solver” is a unique approach to find the best corrective values for a given lot. The solver takes care for very specific configurations like: it accepts targets from different features with different specifications to calculate the correction it accept target specific specifications and optimizes according to the probability of a specification violation. The solver minimizes the maximum failure. The user can use the specification to fine tune lithoAPC for the chip design. The solver will access any parameter model configured by the user for the process tool.
Every APC solution is a critical part of semiconductor production. This concerns both the availability of the APC solution and the support for new requirements. We offer a source-code option for the APC solution, which allows you to integrate your own modules, implement new functions and, if required, continue to develop the solution independently.


All modules are integrated into the APC desktop application. The user interface combines all functionality to setup, monitor and control the APC control. In details this covers:
- visualize measurement and process data visualize
- create, delete and setup all master data
- control status of master data
- visualize and compare all analysis results and
intermediate information including- systematic failure
- value and residual statistics
- residuals
- trigger manual analysis for single or selected runs
- edit run context information or measurement values
- access wafer visualizations
- visualize the process time line in diagrams
- access user management and system capabilities
- connect to any lithoAPC server in the network
- export and import functionality
- copy of all table information
The ongoing development of the system will produce frequent new modules and new features accessible in the user interface.
The analysis of lithoAPC is document and work-flow based. The work-flow is defined by the engineers in the master data. It contains the general flow of dedicated analysis steps and their settings. The document approach ensures, that all details of the analysis is collected into a single document, which is stored in the system database. It can be reviewed by the engineer at any time.
The calculation of the startup values is based on previous runs and their optimal process conditions. The system expects a continuous distribution and tests the data quality. The flier elimination will detect and remove all runs, which do not follow the common behavior.
Flier elimination is based on a combination of absolute flier limits and the definition of relative tunnels.
The “Advanced Solver” is a unique approach to find the best corrective values for a given lot. The solver takes care for very specific configurations like: it accepts targets from different features with different specifications to calculate the correction it accept target specific specifications and optimizes according to the probability of a specification violation. The solver minimizes the maximum failure. The user can use the specification to fine tune lithoAPC for the chip design. The solver will access any parameter model configured by the user for the process tool.
Every APC solution is a critical part of semiconductor production. This concerns both the availability of the APC solution and the support for new requirements. We offer a source-code option for the APC solution, which allows you to integrate your own modules, implement new functions and, if required, continue to develop the solution independently.

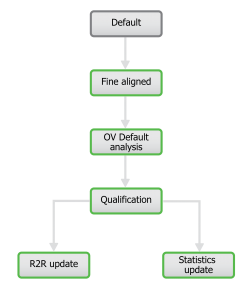
All activities are workflow based. An analysis document is processed by several sequential steps. The workflow is under full control of the user.
- A workflow can be
- Dynamically changed (enhance workflow for current run)
- Parametrized (use run specific process setup for all calculations)
The analysis document is stored in the database. It contains all details of any analysis step. The user has full access to all details within this document.
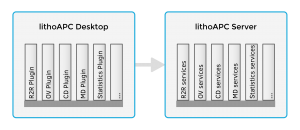
- PlugIn architecture
- Supports flexible, user specific deployment
- Allows to add new functionality or to rem
- ove
functionality - Extensible (by user and 3rd party)
- Existing (productive) modules:
- R2R, CD, OV, MasterData, Statistics
- Modules in work:
- CMP, WaferLayout management, User management
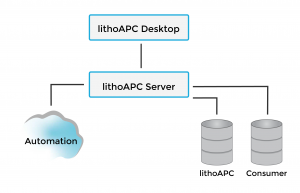
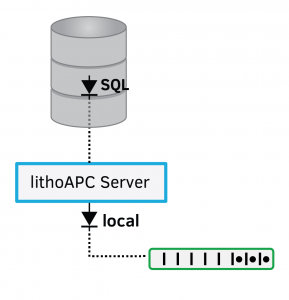
- Flexible integration into any infrastructure
- Tool connection implemented by customer specific agents
- Connect by MessageBus, Web-Service calls or other protocols
- Database connection implemented using Hibernate
(support for all common database management systems) - Scalable & configurable deployment
- Runs single or multiple servers
- Dedicated server for online requests
(process tools) - Hosted on shared or distinct physical servers
- Proven on virtual infrastructure
- Requirements
- 12 GByte memory
- 500 GByte storage
- 1 GBit network interface
- i7 Quad-core CPU
- Oracle 9 ++
(or SqlServer, MySql, Postgres, DB2)